
How do you quantify
good control-valve performance?
Compare measured tracking and small-step response, then evaluate the assembly against the needs of its application.
Define “good” as a measurable result
A control valve is not “good” simply because it strokes smoothly or reaches fully open and fully closed. Evaluate how closely actual valve travel follows a changing command, whether the valve responds to small changes in both directions, and whether that response is repeatable. Agree on acceptance criteria for the application.
Measure actual valve-shaft travel against the input signal. A positioner may detect actuator movement while clearance in a coupling absorbs part of that movement before it reaches the valve. The result that matters is the response of the complete valve, actuator, connection and positioner.
The valve price is only part of the cost
When valve travel fails to follow demand, the process can lose production, consume excess material, produce off-spec product, and require repeated operator intervention. Over time, that lost operating value can exceed the purchase price of the valve package.
During incoming inspection, before installation, compare the command signal with actual valve-stem travel. Measure at the valve stem rather than relying only on the positioner’s indicated position: lost motion in couplings or linkages can leave the valve stem behind even when the indication looks correct. Ramp, small-step and reversal tests show whether the supplied assembly follows the command consistently.
International Paper’s measurable evaluation yardstick
Easytork reports that International Paper used concrete performance criteria for this evaluation: average hysteresis, deadband and lag (HDL) error below 3% of full span during a 50-second nominal-span ramp, plus resolution and sensitivity tests to check small-command response. The linked reports document increasing and decreasing resolution steps of 5%, 2%, 1% and 0.5% of span, and repeated 0.5% sensitivity commands.
These are the criteria discussed for this evaluation, not a universal industry standard. The reports provide measured results; the customer’s acceptance decision is a separate judgment.
Reference criteria used in this comparison
The qualification basis discussed here uses a 3% average-HDL tracking-error threshold at a 50-second nominal-span ramp and a 50% absolute step-error threshold for the specified resolution and sensitivity tests. These are reference criteria for this comparison, not universal industry limits or a substitute for the customer’s acceptance decision.
- Baseline tracking: average hysteresis, deadband and lag (HDL) error below 3% of full span.
- Resolution: increasing and decreasing commands at 5%, 2%, 1% and 0.5% of full span.
- Sensitivity: repeated 0.5%-of-span commands, equivalent to 0.08 mA on a 4–20 mA signal.
- Step-error reference: below 50% of the commanded step. A measured result above that threshold does not meet that numerical criterion, even when the customer accepts the assembly.
Individual diagnostic reports may use different acceptance settings. Read the results and the customer’s decision separately.
Why a small-step test adds information
A smooth, continuous ramp can look satisfactory even when the assembly loses part of a small command. Test both increasing and decreasing steps, including a change of direction. Reversal helps reveal lost motion: the actuator can move while clearance is taken up before the valve shaft responds.
A 0.5% command describes the size of the test step, not an allowed error of ±0.5%. For example, moving from 50.0% to 50.5% travel is a 0.5%-of-span command. Step error is expressed as a percentage of the commanded step, not as a percentage of full valve travel. Merely detecting some movement is not enough. Step size describes the command; response error describes how closely the measured valve movement follows it.
Understand what the numbers measure
Baseline HDL and the HDRL tests
The baseline test compares the input command with travel measured at the valve stem through a defined ramp, rather than actuator output movement alone. Here, HDL means hysteresis, deadband and lag. Ramp time and units define the basis of the tracking-error result. HDRL examines hysteresis, deadband, repeatability and linearity; the diagnostic reports separately list hysteresis plus deadband, repeatability and linearity as percentages of full span.
These tests help explain different behaviors. Hysteresis and deadband concern the difference between increasing and decreasing response; repeatability asks whether repeated commands produce the same result; linearity describes deviation from the reference relationship. These separate measurements distinguish reversal error, consistency over repeated commands and deviation from the reference relationship.
COMPARISON 1 · REPORTED BASELINE TRACKING
Three assemblies, one diagnostic framework
International Paper performed the two Easytork assembly tests at its Prattville and Rome mills. Their reports identify International Paper as the report preparer, providing third-party test evidence. All three reports use Black Diamond BenchMark diagnostics to compare command signal with measured valve-stem travel, with a 50-second nominal-span ramp for the baseline test.
| Tested assembly | Average HDL | Maximum HDL | Diagnostic report |
|---|---|---|---|
| Easytork with DVC6200 | 1.41% | 2.32% | Prattville · B20004P2 / N20001P2 · PDF → |
| Easytork with Siemens PS2 | 1.18% | 2.04% | Rome · B90019L9 · PDF → |
| Rack-and-pinion with Siemens PS2 | 3.11% | 4.26% | B10066ET · PDF → |
The two Easytork assemblies recorded average HDL errors of 1.41% and 1.18%, below the stated 3% baseline criterion. The rack-and-pinion assembly recorded 3.11%, above it. Easytork reports that International Paper accepted both Easytork assemblies and rejected the rack-and-pinion assembly. Customer acceptance is distinct from meeting every numerical reference criterion: the Rome report records 52.8% error on one 0.5% command step, above the 50% step-error reference discussed here.
COMPARISON 2 · STEP RESPONSE
Positioning accuracy: see the actuator change
The two plots below compare the same valve and positioner with different actuators. These BenchMark step-resolution plots show measured valve-stem response to increasing and decreasing commands, including the smaller steps near the end of each sequence.
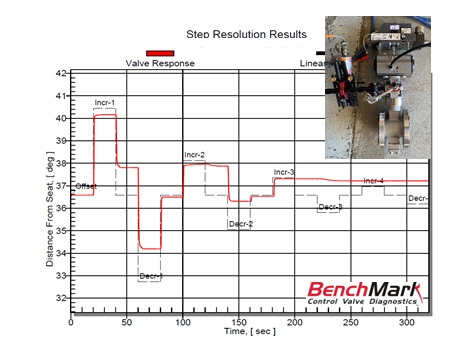
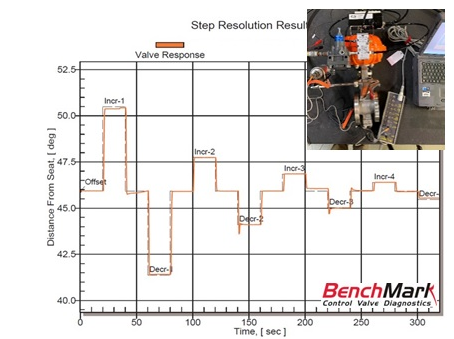
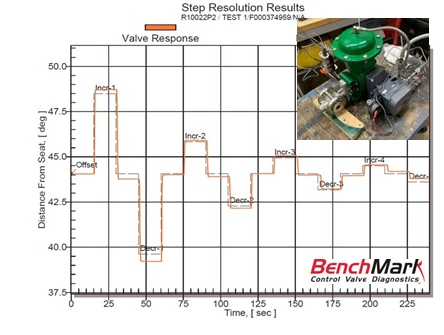
Read time in seconds on the horizontal axis and valve-stem position in degrees on the vertical axis. The plots use different position ranges; compare the response to each commanded step, not the absolute starting position. The Fisher package is a separate valve-package example, not the actuator-swap pair. These illustrations are separate evidence from the three diagnostic reports above.
See the diagnostic reports behind the measurements
The linked reports use BenchMark, Black Diamond Engineering’s control-valve diagnostic system, to show the response of the tested assemblies.
- Control-valve solutions: original test evidence brings the response plots and a separate positioning-system result together.
These existing ECA test records describe the shown configurations. Valve geometry, coupling fit and test conditions affect the measured response, so the results apply to the stated assemblies.
Connect the measurements to the hardware
The positioner receives the command signal and adjusts pneumatic outputs to control actuator travel; the actuator develops motion, and the drive connection transfers that motion to the valve. Clearance, friction and the fit of that connection can show up in small-step and reversal tests.
Easytork’s vane architecture produces rotary motion directly. Its ECA control-actuator work uses close-fitting valve connections for demanding modulating duty, while EVA configurations emphasize adaptable mounting. Choose the connection for the required control performance, then measure the supplied assembly.
Explore valve-to-actuator mounting and direct coupling → · See how vane actuation develops torque →
References
- Black Diamond Engineering: BenchMark diagnostics and configurable performance standards.
Review your control-valve application
Connect the performance you need with the valve, actuator and positioner arrangement.
Contact us →